728x90
Mitigating starvation in dense WLANs: A multi-armed Bandit solution
🔑 중앙의 administrator가 MAB를 주어진 WLAN의 AP들의 optimal configurations를 찾고자함
Objective function
⇒ evaluates the quality of a network configuration for any WLAN
$N_A$ 개의 AP에 대해 각 AP는 $(\text{TX_PWR}, \text{OBSS/PD})$의 configuration parameters를 가지고 있다.
- guarantee enough throughput for each AP and STA ➡️ the starving STAs의 개수로 판단
- ensure a fair share of nodes in WLAN ➡️ Jain’s index와 같은 fairness metrics로 판단
- maximize the WLAN overall throughput ➡️ the system over throughput으로 판단
위 세 개를 충족시키는 최적의 $N_A$ pairs of parameters $(\text{TX_PWR}, \text{OBSS/PD})$ 를 찾고자 함
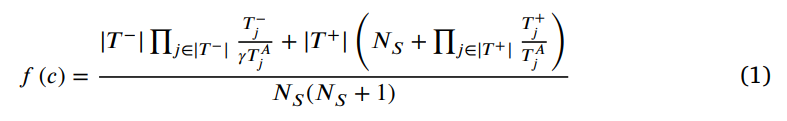
We consider the proportional fairness (PF), which is simply obtained by multiplying the normalized throughputs of STAs, i.e., $\Pi_i{T_i/T_i^A}$ , to obtain a natural tradeoff between criteria (ii) and (iii).
the starving STAs
$$
T_i/T_i^A < \gamma
$$
- $T_i$ : STA $i$ 의 throughput
- $T_i^A$ : STA $i$ 의 attainable throughput
- the throughput STA $𝑖$ would have in the absence of all other competing devices in the
WLAN.
- the throughput STA $𝑖$ would have in the absence of all other competing devices in the
- $\gamma$ : Starvation threshold for a STA (Say $\gamma$ = 10%)
Multi-armed bandit solution

- 총 $21^{2N_A}$의 arms ➡️ almost infinite
⇒ IMAB (Infinitely Many-Armed Bandit) 문제로 치환
- Sampler 와 Optimizer로 프로세스를 구분
- Sampler를 통해 Optimizer에 적용할 “a subset of arms”(the optimizer’s reservoir)를 구함
Optimizer
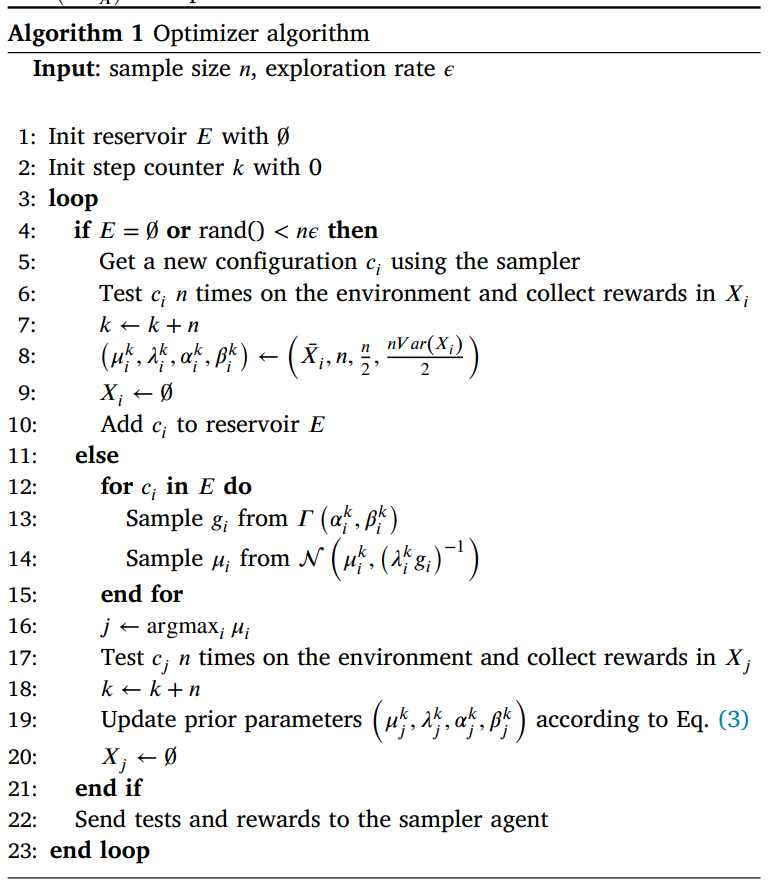
- Thompson Sampling 이용
- $n\epsilon$ 의 확률로 Sampler로부터 new configuration을 받아와 실험
- reservoir $E$에서 가장 최적의 값을 가지는 configuration으로 실험
- sampling을 통해 exploration
- $\argmax$을 고름으로써 exploitation
Sampler


- P=2 starting points : the default configuration of 802.11 and one that minimizes the average degree of the WLAN’s conflicts graph.
- the default configuration of 802.11 $(\text{TX_PWR}, \text{OBSS/PD})$ = $(20, -82)$
- two APs are in conflict : cannot transmit at the same time.
- conflict graph of APs의 average degree가 0.5가 될 때까지 round-robin 방식으로 $\text{TX_PWR}$ 감소
예시

Numerical results
Experimental Settings
Scenarios
- T1
- 6 APs, 12 UEs
- T2
- 10 APs, about 50 STAs
- an average of 5 STAs per AP
- high dense wifi deployments
- T3
- 10 APs about 50 STAs
- an average of 5 STAs per AP
- T2보다 AP와 STA 사이의 평균 거리가 더 멀어
Simulator Parameters Set

Points
- Starvation 을 판단하는 기준을 적용한 것
- Realistic Goals
- Centralized Computation
- Almost Infinite Number of Arms
728x90
반응형


댓글